
2023 Personal Project
NYC Skyline
A Data Map of Skyscraper Growth
Project Type
Data Visualization
My Role
Frontend Engineer
Timeline
Feb-May, 2023
Responsabilities
Web Design
Prototyping / Programing
Tools
p5.js • mapbox.js •
HTML & CSS
Project Brief
New York City’s skyline is iconic — yet the patterns behind its vertical evolution are often hidden in raw data or overlooked entirely. From height competitions to boom cycles in development, skyscraper growth reflects historical, economic, and cultural shifts.
This project transforms over a century of skyscraper data into an interactive, map-based visualization. Users can explore how the city’s tallest buildings have changed over time in terms of height, function, location, and era of construction.
By mapping these structures, the tool reveals trends in urban planning, development cycles, and architectural ambition — helping users see the city not just as it is, but how it grew to be.
Interactive Prototype
Context
Project Scope
Periodical Development Trend
This project aims to tell the story of New York City's architectural marvels - all skyscrapers in the city, through an interactive data visualization. By collecting data of buildings with 500+ ft (150+ meters), the project will provide users with an engaging and informative tool to explore these structures, and showcases the growth and development of the city's skyline over time.
Tracing Evolution and Trends in Skyscrapers
How have NYC's tallest buildings evolved in terms of height, floor numbers, function, and location?What historical, architectural, and urban planning trends can be observed from the development of these skyscrapers?
Key Questions
Tracing Evolution and Trends in Skyscrapers
How have NYC's tallest buildings evolved in terms of height, floor numbers, function, and location?What historical, architectural, and urban planning trends can be observed from the development of these skyscrapers?
Project Setting
A Web-Based Exploration Tool
This project targets architecture enthusiasts, tourists, urban planners, and NYC residents keen on the city's skyline, etc. The visualization is accessible through a web-based platform, making it suitable for use in as a tool for exploring the city's history and landmarks.
Feature Overview
Clustering
01
Cluster Function on Map
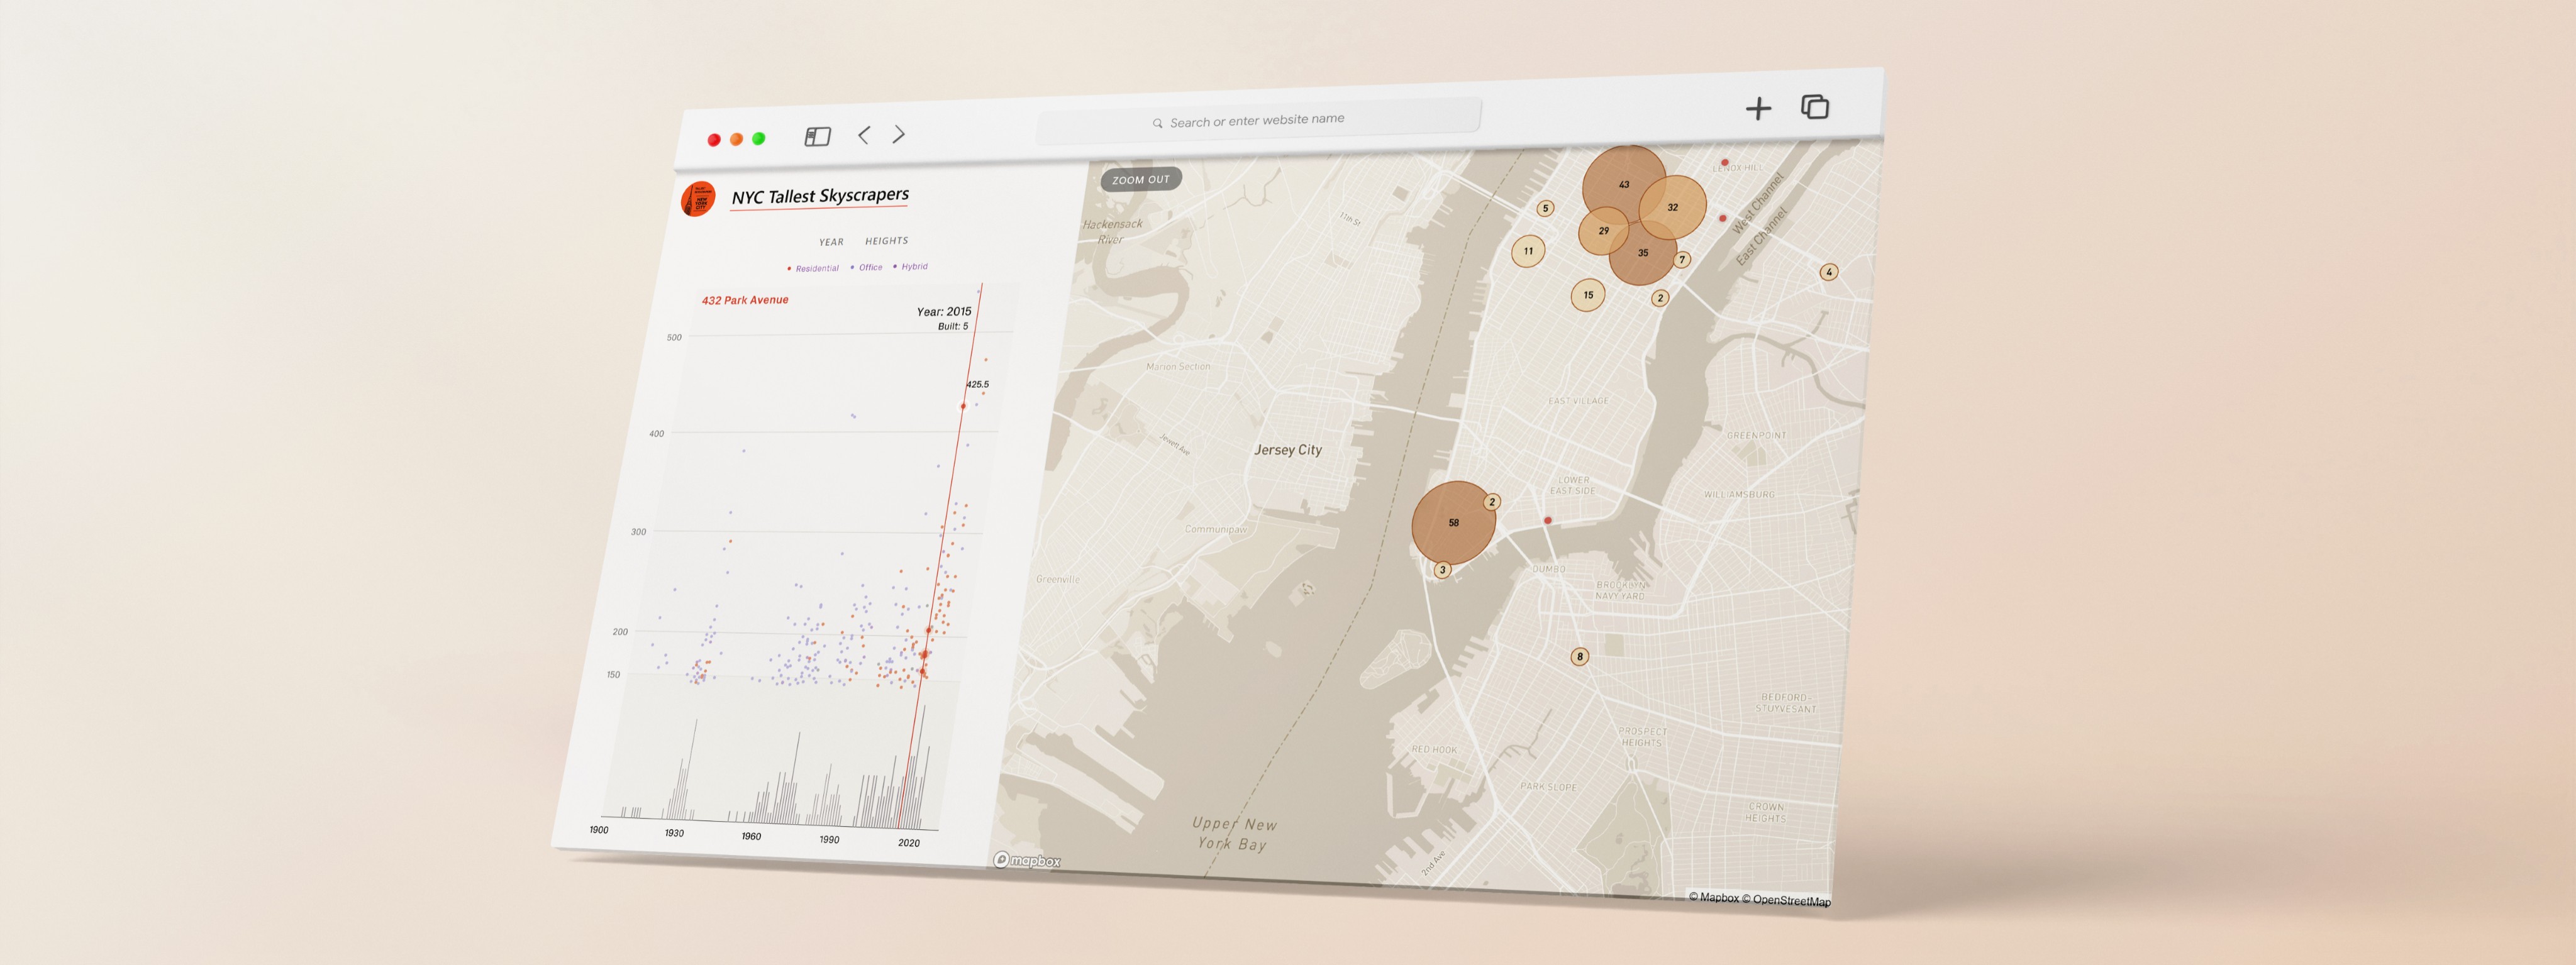
A clustering feature groups buildings when zoomed out, offering a clear visual of high-rise concentrations. Users can click to zoom in and explore specific areas.
Color-Coded Building Types
Buildings are color-coded (red for residential, deep blue for office, deep green for mixed-use) to provide insights into the typology and trends in building purposes over the years.
Chronological Filter
02
Chart Visualization as a Filter
The left-side chart acts as a filtering tool, displaying the distribution of over 261 skyscrapers higher than 150 meters. Users can sort and explore specific buildings using this interactive chart.
Detailed Skyscraper Data
The chart plots each building, with the x-axis representing the year built and the y-axis indicating height. It includes all structures, whether completed, under construction, or demolished.
Heights Ranking
03
Interactive Map with Detailed Views
The right-side map zooms into selected buildings for more detailed exploration. Users can interact with the map to view building contexts, details, and color-coded heights.
Cluster Function on Map
A clustering feature groups buildings when zoomed out, offering a clear visual of high-rise concentrations. Users can click to zoom in and explore specific areas.
Interactive Map
04
Interactive Map with Detailed Views
The right-side map zooms into selected buildings for more detailed exploration. Users can interact with the map to view building contexts, details, and color-coded heights.
Insights & Data
Project Insights
Periodical Development Trend
The growth of skyscrapers in NYC has been periodic, with distinct peaks in development during certain years since the early 1910s. This suggests patterns influenced by historical, economic, or technological factors.
Height Competition and Evolution
This project targets architecture enthusiasts, tourists, urban planners, and NYC residents keen on the city's skyline, etc. The visualization is accessible through a web-based platform, making it suitable for use in as a tool for exploring the city's history and landmarks.
Project Data
The source data for this project comes from publicly available databases and resources, including Council on Tall Buildings, Urban Habitat (CTBUH) and the Skyscraper Center. The data is in the form of flat files (CSV & JSON format) and include information on building height, floor numbers, functions, built year, and location. Additional data, such as images and architect information, are sourced from online resources and APIs.